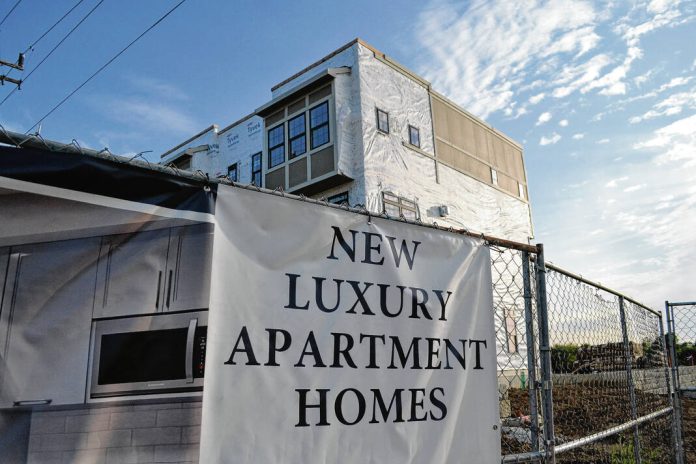
Affordability, a lack of options and corporate ownership are just a few of the factors affecting housing in the Indianapolis area, a new study shows.
A Central Indiana Housing Study recently completed by the Indianapolis Metropolitan Planning Organization was the focus of a nearly 30-minute presentation to the Greenwood Advisory Plan Commission Monday night. The IMPO is a governmental organization tasked with regional planning for areas of Boone, Hamilton, Hancock, Hendricks, Johnson, Marion, Morgan and Shelby counties.
The analysis of housing and related factors took place from January 2023 to January 2024 across IMPO’s eight-county region. The goal was to provide a regional housing perspective and not just a view of individual towns or cities, said Andrea Miller, a senior planner for IMPO.
Some additional key findings are that housing costs were rising faster than home-buyers purchasing power and the region’s rapid population growth is expected to continue.
Housing costs, more growth
Across all IMPO counties, the median home sales price increased by 31.6% and rents rose 21% from 2020 to 2022. While the 2023 numbers included in the study were not yet final, they were still rising. Interest rates also rose during the period, Miller said.
Based on the study, a buyer who puts down a 20% down payment to buy a $300,000 home — the median price for the region — with an interest rate of 7.5% would need to have a household income of $89,550 to afford the home. The average median household income in the region is $73,173, she said.
About 61.7% of renters in the region are cost-burdened, meaning they are spending more than 30% of their income on their rent. 30% of renters are severely burdened, Miller said.
In terms of homeowners, 24% are cost-burdened, with about 9% severely so, data shows.
The region’s rapid growth is expected to continue for the foreseeable future, with an increase of 111,000 households expected. By 2033, the region will need 42,000 additional housing units, or roughly 400 a year, to keep up with the growth, Miller said.
Unaffordability, housing gaps
Miller highlighted another key result from the study: housing unaffordability is a problem for everyone, not just those who are trying to buy or rent right now.
Housing is a quality of life issue, Miller said. This is because limited housing leads to longer commutes, more cost-burdened renters and homeowners and other compromises. It also affects the availability or quality of services and goods provided, she said.
An example of this is a restaurant reducing hours or staffing because they’re not able to pay workers enough to keep up with rising housing costs, Miller said.
“You might see a situation where a business reduces their operating hours, maybe half of the dining room is closed, because they don’t have enough waiters or waitresses to service the other half,” she said.
Unaffordability is also a workforce development issue. Existing businesses and industries that are not keeping pace with the cost of living will struggle, she said.
Talent and business attraction are contingent on housing availability too, and often is smaller local and regional businesses that struggled the most, Miller said.
“An example of what this could look like is a company deciding not to locate in a given area because there’s just not enough housing for the cost of housing and thus the worker salaries are just too high relative to the advantages provided,” she said.
The study also looked at gaps in current housing inventory based on housing preferences from residents, Miller said. One gap is that the Indianapolis area as a whole doesn’t have a lot of smaller ownership units — housing options with two bedrooms or less.
There are also too few affordable units for those at lower income levels, especially for smaller one or two-bedroom options. Residents also indicated the region has more mid- and high-cost three and four-bedroom homes than they would prefer, she said.
The housing stock available today is built for households of the past, as people are having fewer children, having them later in life, or not at all. People may not want large houses, Miller said.
Additionally, more singles and couples prefer “walkable lifestyles,” shifting demand from single-family suburban subdivisions. Baby Boomers and empty-nesters are also downsizing more, she said.
Contributing factors
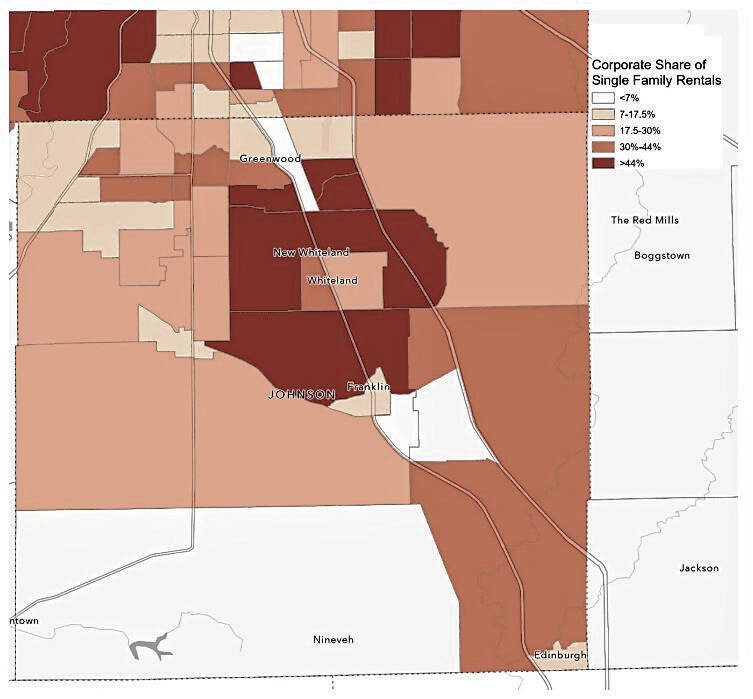
There are several forces affecting the Indianapolis market including changing construction costs, mortgage rates and corporate investors buying up lower-priced, single-family homes to rent them. In some neighborhoods, corporate investors own 30% of housing stock, Miller said.
Johnson County is second behind Marion County in terms of corporate single-family homes for rent. Between 7-9% of all single-family homes in the Greenwood and Whiteland areas are owned by a corporate investor, according to the study.
This density corresponds with higher rates of foreclosure and the persistent duration of foreclosed properties following the Great Recession, which enabled large firms to acquire properties below market rates, the study says.
In terms of rental share, 43% of rental homes in New Whiteland, 40.1% in Greenwood, 34.8% in Franklin, 24% in Whiteland, 18% in Bargersville and 11.1% in unincorporated Johnson County are owned by corporate investors. Greenwood has the largest number of total homes with 1,062, compared to a low of 58 in Whiteland, the study shows.
As for the policy and public factors, zoning and design standards can also limit options and drive up costs. Many of these restrictive standards and plans are driven by public opinion, Miller said.
Even if a housing project is permitted under a city’s regulations, public pushback can end a project before it starts, she said.
“Sometimes these fears are valid, but often they can be based on inaccurate fears,” Miller said. “So really going in and addressing … the root concern is critical.”
Solutions
There is not a single option that can be used to solve the issues facing the region, but IMPO does have a toolkit to provide strategies that can help.
These strategies fall under four goals for the organization:
- Establishing a shared understanding of the history and current state of housing in Central Indiana;
- Introducing a regional housing strategy that connects communities and promotes equity;
- Providing context and guidance for the public and government leaders to inform public decision-making on housing issues and policy; and
- Supporting collaboration and policy change at the local and regional levels.
Examples of these strategies include maintaining a housing plan, setting house goals and having a housing element in the city’s comprehensive plans. Other strategies include implementing home repair and foreclosure programs, updating zoning ordinances and design standards or establishing a rental registration and license ordinance program to ensure greater transparency and accountability in the market, according to the study.
Following Miller’s presentation, city officials were asked whether Greenwood matched the housing preferences outlined in the study. Planning Director Gabe Nelson thinks the city does not right now, but some of the projects underway are starting to address it as officials look inward for redevelopment, he said.
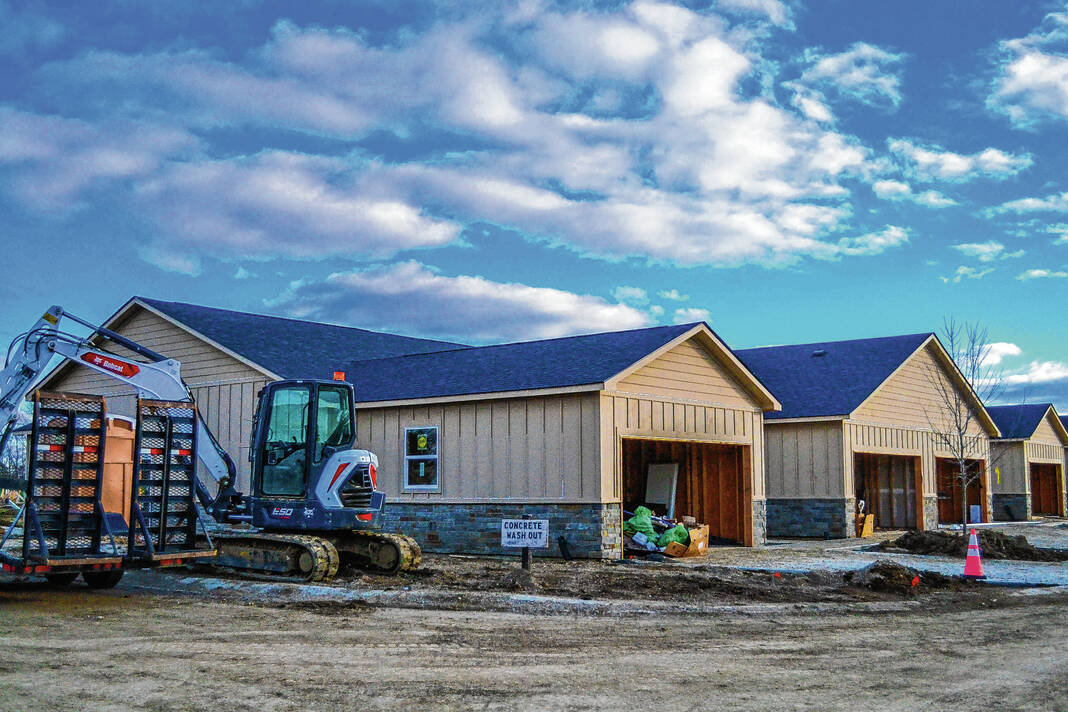
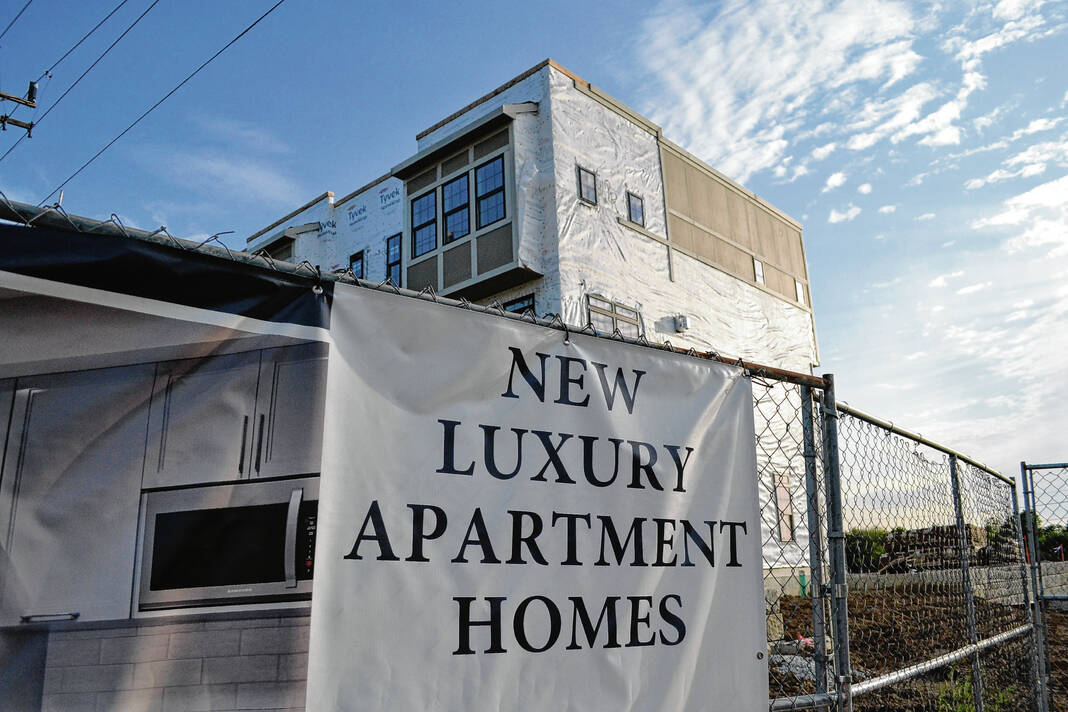
An example of this is The Madison and its townhomes, which are smaller homes with fewer bedrooms, he said. The city typically sees a lot of single-family subdivisions and while there is a need for them, Nelson acknowledged more and more people are wanting places that are smaller or have a walkability element.
“I think there is still demand for the single-family housing that we’re seeing and that we really can’t even keep up with the demand for it,” Nelson said. “I just also think we need to expand the different types of housing that we’re providing.”
CHECK IT OUT
To check out the study, go to indympo.org/whats-underway/central-indiana-housing-plan. There two versions: abridged and complete.
BY THE NUMBERS
Corporate Ownership of Single-Family Rental Homes in Johnson County
Bargersville
Total Homes: 65
Share of Rentals: 18%
Franklin
Total Homes: 542
Share of Rentals: 34.8%
Greenwood
Total Homes: 1,062
Share of Rentals: 40.1%
New Whiteland
Total Homes: 172
Share of Rentals: 43%
Whiteland
Total Homes: 58
Share of Rentals: 24%
Unincorporated Johnson County
Total Homes: 166
Share of Rentals: 11.1%
Source: IMPO


